Ice Hockey Talent Scouting

Phase 1: Data Integration & Pre-processing


Group 21
Ahmed Tamim Sharif | Md Rafat Jitu | Md Istain Ahmed

Objective & Datasets

Data Integration (Merging Strategy)

Data Cleaning - The Roman Numeral Issue

Advanced Cleaning - The Age Anomaly

Handling "Unknown" Data (Crucial Step)

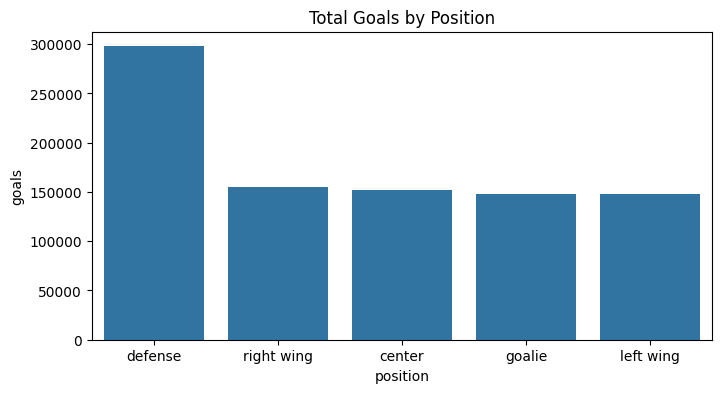
Visualization 1 - Total Goals by Position

  • Insight 1: Surprisingly, the Defense position has scored the highest total number of goals (300,000).
  • Insight 2: Right Wing, Center, and Left Wing show relatively similar goal-scoring totals (150,000).
  • Significance: 'Position' proves to be a highly influential feature for future predictive modeling.
Goals by Position

Visualization 2 - Age vs. Shot Speed

  • Insight 1: Active players range precisely between 18 and 39 years.
  • Insight 2: Highest shot speeds are predominantly clustered among players aged 22 to 32.
  • Insight 3: We observe a slight decline in maximum shot speed as players cross the age of 35.
Age vs Shot Speed

Visualization 3 - Correlation Matrix

  • Insight 1: Correlation values between variables are extremely low (e.g., -0.023, 0.0079).
  • Insight 2: This implies player performance doesn't rely on just 1 or 2 metrics; rather, it is a combined result of multiple factors.
  • Modeling Strategy: Due to the lack of direct linear relations, we will use complex, non-linear ML models (e.g., Random Forest) in Phase 2.
Correlation Matrix

Conclusion & Next Steps